Building a Metric to Find the Most Average NHL Player
NHLPython
Who is the NHL’s most average player? It’s Tanner Pearson of course! Of course? Yes! And I even designed a metric to capture this quality to answer the question. I’m calling it the Averageness metric.
The code for building the averageness metric can be found here on Gitlab. I used two data sources: The NHL basic skater stats for 2021–2022 and the NHL bio information of players for the 2021–2022 season. And I joined and prepped them using SQL for being ingested as a pandas dataframe in Python.
Without further ado, let’s jump in the fabulous world of averageness.
Step 1: The Goal and Basic Idea
The goal of the averageness metric is to capture how close a certain player is to the perfectly average NHL player. It’s trivial to find how average a player is for a single metric (ie. scoring goals), but I really wanted to find the overall most average player.
So, for each selected attribute to be included in the metric, I decided to find its mean and standard deviation. This way, for each player and attribute, I could find the absolute value of how far a player was from that attribute and divide it by its standard deviation — finding how many standard deviations away from the average of the attribute a player is.
Now might be time to introduce said attributes.
Step 2: Feature Selection and Engineering
After obtaining the data (which was step 0 really), and setting up a basic goal for the metric, the next step was to decide which players and which metrics to include in the averageness score.
I filtered the dataset to players who participated in more than 41 games. My rationale being, anyone participating in the majority of the NHL season must be an NHL regular for that particular season. Or at least, a semi-regular and I’d like to count them in the metric.
From the NHL bio dataset, I figured that an average player would have an average height, weight and age. After all, guys like Zdeno Chara and Cole Caufield are so tall and small respectively, that it’d be difficult to categorize them as “average”.
From the NHL stats dataset, I loved a lot of the features. I standardized most of them to a “per game” basis to have everyone on the same level. I also separated “Goals” and “Assists” from “Points”, such that a great playmaker or great goal scorer could not be an average player based on points only.
Here is the list of attributes I selected:
- Goals per game
- Assists per game
- +/-
- PIM per game
- Even Strength Goals per game
- Even Strength Assists per game
- Power Play Goals per game
- Power Play Assists per game
- Shorthanded Goals per game
- Shorthanded Assists per game
- Game Winning Goals per game
- Shots per game
- ATOI
- Height
- Weight
- Age I did not use points since there are simply the addition of goals and assists.
Also, since defensemen and forwards have wildly different responsibilities and styles of play, I performed the calculation separately for both (so, performed the mean for forwards and the mean for defensemen). I even performed a test in the past that showed that there was statistical significance at the 0.95 level that forwards and defensemen had different heights and weights!
But, enough preparations… what makes a player perfectly average?
Step 3: Who is the Perfectly Average Player?
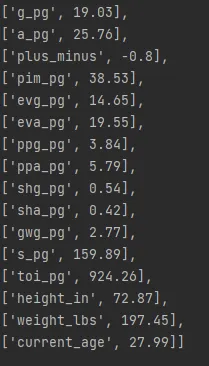
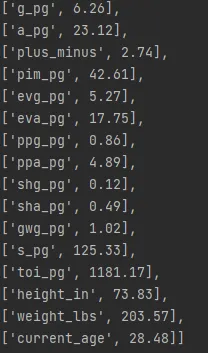
Now that our attributes are defined and built, let’s look at what are the averages for each (prorated to 82 games for simplicity).
So, the average forward scores about 19 goals, or which about 15 are scored at even strength and 4 on the power play. They do 26 assists, 20 at even strength and 6 on the power play, for a total of 45 points (they might have about a shorthanded point in there). 3 game winning goals for our average player. They also take about 38 penalty minutes over 82 games and shoot 160 times during a season. All that while playing 924 seconds (15 minutes of play)!
Height wise, they’re just over 6 feet tall, and weight 197 pounds. They are 28 years old.

The average defenseman scores about 6 goals, or which about 5 are scored at even strength and 1 on the power play. They do 23 assists, 18 at even strength and 5 on the power play, for a total of 29 points (they might have about a shorthanded point in there). 1 game winning goals for our average player. They also take about 42 penalty minutes over 82 games and shoot 125 times during a season. All that while playing 1181 seconds (19.6 minutes of play)!
Height wise, they’re just over 6 feet 1 inch tall, and weight 203 pounds. The average defenseman is slightly older than the average forward at 28.5 years old.

Step 4: Finding the Most Average Players
Now, this is all fun, but we still don’t know who’s the most average player in the NHL…
I also found the standard deviations of each attribute. For each player, I went through each feature and found the absolute value of how far they were from the average. I then divided that value by the standard deviation to obtain a value representing how many standard deviations from the mean was the player:
dist_from_mean = abs(player_value - mean)/std
This for each metric, then I summed them all up to obtain a single averageness score.
I compiled a top 10 overall, top 10 forwards and top 10 defensemen:
Overall Top 10:
- Tanner Pearson, F: 5.1
- Rickard Rakell, F: 5.7
- Jack Roslovic, F: 5.9
- Jonas Brodin, D: 6.0
- Sonny Milano, F: 6.0
- Travis Boyd, F: 6.1
- Artem Zub, D: 6.2
- Kasperi Kapanen, F: 6.3
- Hampus Lindholm, D: 6.3
- Brett Kulak, D: 6.4
Forward Top 10:
- Tanner Pearson: 5.1
- Rickard Rakell: 5.7
- Jack Roslovic: 5.9
- Sonny Milano: 6.0
- Travis Boyd: 6.1
- Kasperi Kapanen: 6.3
- Ivan Barbashev: 6.4
- Christian Dvorak: 6.6
- Denis Gurianov: 6.7
- Kieffer Bellows: 6.8
Defensemen Top 10:
- Jonas Brodin: 6.0
- Artem Zub: 6.2
- Hampus Lindholm: 6.3
- Brett Kulak: 6.4
- Ben Hutton: 6.9
- Oliver Ekman-Larsson: 7.0
- Justin Braun: 7.2
- Nick Jensen: 7.3
- Nate Schmidt: 7.3
- Jake McCabe: 7.4
The forward list looks really good to me. A lot of players who, at a glance, produce middle 6 offensive numbers and don’t have crazy attributes that makes them stand out. They’re also players from a variety of teams.
Honorable mention to Lars Eller who is the 11th most average forward on my list and gets a lot of love in these discussions!
The defense list I’m a little less proud, because the averageness doesn’t account for defensive attribute much, if at all. This means that some players like Jonas Brodin and Hampus Lindholm, are highly respected for their excellent defensive play, are part of the top 10; They probably should not be close to these lists at all.
Shutout to Cale Makar who had the highest averageness score, that is, he was the least average player in the NHL! And by a good amount, he leads 2nd place Victor Hedman 38 to 31. Take it how you want, the least average players must be pretty special!
Step 5: Conclusion and Next Steps
This was a very fun exercise to do! It allowed me to sharpen my data mining skills by using the NHL API to acquire the bio data, and build a little local SQL database to bring the stats and bio datasets together.
I also had to read the pandas.to_dict documentation to set my data the way I liked in a dictionary; I learned that it is possible to set the keys and values in various different ways by using the “Orient” parameter.
It was also very fun to see that the list of average players I created looked pretty accurate and highlighted a lot of players that I would not usually think about! Some surprises like Travis Boyd who’s a much better player than I thought he was.
For the future though, if I were to revisit this metric, I’d add some new key attributes like “Hits”, “Takeaways” and “Giveaways” to get at least some more defensive metrics in there, which would hopefully help the scoring of defensemen be a little more accurate.
I would also probably try to eliminate metrics that correlate too much to each others, I’m sure I could eliminate one of “Total Goals”, “EV Goals”, “PP Goals”, “SH Goals” (ditto for assists), since they the last 3 all sum up to the “Total”.